PropNex Picks
|November 19,2025Resale Condo Market Watch in October 2025
Share this article:
Healthy resale condo activity in October amid robust new launch market
Sales momentum in the overall property market continued its streak in October, including the resale condo market. About 947 condo units worth $1.95 billion was resold during the month - compared with the 1,097 resale transactions valued at $2.17 billion transacted in September.
The resale home market simmered slightly as new launch activity resurged during the month. Momentum in the new sale market rebounded strongly with over 2,400 new units transacted amidst a flurry of new launches. In October, new sales accounted for more than 70% of non-landed transactions, while resale deals accounted for the minority of transactions (27.6%, see Chart 1).
Chart 1: Proportion of private non-landed transactions (excl. EC) by sale type by month
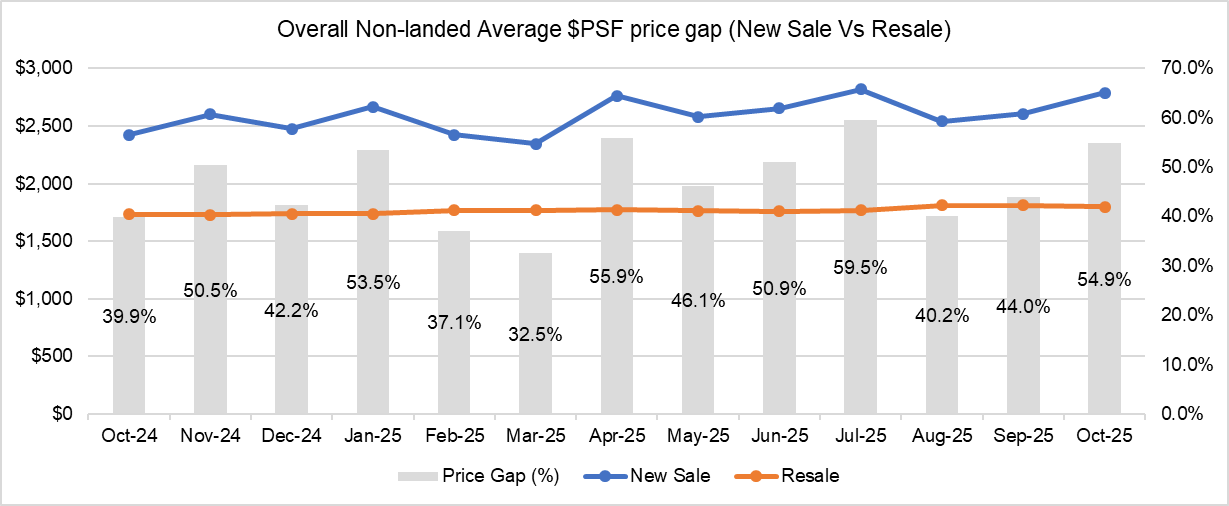
With the resurgence in new launch activity during the month, the average unit price of new non-landed homes expanded. The average new sales price grew by 6.9% month-on-month (MOM) to $2,786 psf in October, while the average resale unit price slipped marginally by 0.6% MOM. As such, the new sale and resale price gap recovered further from 44% in September (see Chart 2), to 55% in October.
Chart 2: New sale and Resale Price gap of non-landed homes (overall) by month
Stable gains amongst resale transactions
In terms of profitability, resale condo units transacted in October saw slightly better gains compared with the previous month. Analysing the profits reaped by resale non-landed private homes in September and October 2025, it was found that resale condo deals garnered slightly higher profits. The proportion of loss-making transactions remained flat in October 2025 over the previous month. The resale profit analysis involves computing gains achieved for the units by matching the condo resale transactions in September against their respective previous purchase price, according to caveats lodged.
The study showed that 13.6% of resale condo transactions (120 deals) in October made more than $1 million in profits, a slightly smaller proportion to September (14%). Of these million-dollar profit-making deals, the deals are evenly distributed amongst the three market segments, 46% in the Core Central Region (CCR) homes and 29% in the Outside Central Region (OCR), followed by the city fringe or Rest of Central Region (RCR) (25%) homes. Loss-making deals in October accounted for 4.8% of transactions, similar to the proportion of loss-making deals (4.8%) in September (see Chart 3).
Chart 3: Proportion of profit quantum of resale non-landed transactions (September 2025 vs October 2025)
The average profit was subsequently computed on a project basis. To minimise sampling errors, resale condominium projects that posted fewer than three transactions during the month are excluded from the study. Based on URA Realis caveat data analysed by PropNex Research, the most profitable condo in the CCR, was St Thomas Suites in District 9, which pulled in an average profit of $951,000 across three transactions in October.
In the RCR, the most profitable condo development in October was The Sea View, a project located in District 15, which achieved an average profit of $1.5 million, across three transactions. The Sea View was also the overall best performing project in terms of average profit quantum in October. In the heartlands or Outside Central Region (OCR), the most profitable project was The Tropica in District 18 which garnered an average profit of $925,000 across four transactions.
Top Resale Condo projects^ in terms of average gross profit* by region (October 2025)
Project Name | No. of transactions | Average Profit Gained ($) | Average Annualized Profit (%)# | Year completed | District |
CCR | |||||
| ST THOMAS SUITES | 3 | $951,000 | 1.1% | 2010 | 9 |
| THE TRIZON | 3 | $903,267 | 3.2% | 2012 | 10 |
| D'LEEDON | 8 | $839,820 | 3.4% | 2014 | 10 |
RCR | |||||
| THE SEA VIEW | 3 | $1,503,000 | 7.8% | 2008 | 15 |
| BRADDELL VIEW | 3 | $1,043,333 | 5.0% | 1980 | 20 |
| GARDENVISTA | 3 | $1,039,054 | 6.1% | 2006 | 21 |
OCR | |||||
| THE TROPICA | 4 | $925,250 | 5.9% | 2000 | 18 |
| GRANDEUR 8 | 3 | $834,333 | 4.5% | 2005 | 20 |
| CASAFINA | 4 | $816,528 | 4.7% | 1999 | 16 |
*Gains are derived from the resale transaction for each unit against the unit's last caveated transaction; the average profit is determined on the profits of all resale transactions in the development which occurred during the month. The profit reflected is gross - it has not accounted for the applicable seller's stamp duties, interest payable, taxes and other relevant divestment costs.
#Annualised Gains is the compounded annual rate of return which shows the rate of return over the time period between the point of resale and the property's last caveated transaction, expressed in annual percentage terms. The formula for determining this is simply: [(current resale price) / (purchase price)] time period in years-1Analysis was done based on available data from URA Realis
Going by districts, resale homes in District 10 (Bukit Timah, Holland) raked in the highest profits on quantum basis, with transactions reaping average gains of over $1.08 million per deal. In terms of annualised gains, resale homes in District 20 (Bishan, Ang Mo Kio) enjoyed an average annualised profit of 5.1% per deal.
Top 10 Resale Condo districts^ in terms of average gross profit* (October 2025)
District | No. of transactions** | Average Gains ($) | Average Annualised Gains (%)# |
D10 | 68 | $1,080,737 | 2.6% |
D20 | 35 | $706,632 | 5.1% |
D11 | 33 | $680,799 | 3.2% |
D9 | 60 | $631,400 | 1.9% |
D15 | 49 | $628,580 | 4.3% |
D21 | 26 | $616,272 | 3.9% |
D16 | 48 | $609,887 | 4.5% |
D3 | 36 | $606,921 | 4.0% |
D12 | 28 | $578,621 | 3.7% |
D22 | 18 | $528,501 | 4.4% |
^Districts with fewer than 10 transactions during the month were excluded from this analysis
*Gains are derived from the resale transaction for each unit against the unit's last caveated transaction; the average profit is determined on the profits of all resale transactions in the development which occurred during the month. The profit reflected is gross - it has not accounted for the applicable seller's stamp duties, interest payable, taxes and other relevant divestment costs.
#Annualised Gains is the compounded annual rate of return which shows the rate of return over the time period between the point of resale and the property's last caveated transaction, expressed in annual percentage terms. The formula for determining this is simply: [(current resale price) / (purchase price)] time period in years-1
Analysis was done based on available data from URA Realis
**Resale units with no available last caveated transaction data are excluded from this analysis
Analysing individual transactions by gross profit quantum, it was found that the top five gainers from each region ranged from $1.5 million to $11.5 million. The units which chalked up bigger gains were mostly sizeable large format condos that are more than 1,300 sq ft in size, and consisted mostly of older projects built in the 1980s to early 2000s. The respective holding periods for the most profitable resale properties were mostly beyond 18 years - the oldest being a unit held for 30 years.
Top 5 Resale Condo transactions in October 2025 by gross profit by region
*Gains are derived from the resale transaction for each unit against the unit's last caveated transaction; the average profit is determined on the profits of all resale transactions in the development which occurred during the month. The profit reflected is gross - it has not accounted for the applicable seller's stamp duties, interest payable, taxes and other relevant divestment costs.
#Annualised Gains is the compounded annual rate of return which shows the rate of return over the time period between the point of resale and the property's last caveated transaction, expressed in annual percentage terms. The formula for determining this is simply: [(current resale price) / (purchase price)] time period in years-1Analysis was done based on available data from URA Realis
**Resale units with no available last caveated transaction data are excluded from this analysis
It was found that the overall most profitable transaction and top gainer in the CCR was for a 2nd floor unit at Nassim Lodge. It was resold for an estimated profit of $11.5 million, reflecting an annualised profit of 5.9%. Based on URA Realis caveat data, the 4,176-sq ft unit was first bought in May 1998 and subsequently resold for $14.5 million in October 2025, with a holding period of 27 years. The freehold project within the prestigious Nassim neighbourhood in Tanglin was built in 1984. The project is situated within walking distance to the Orchard Road shopping belt and a 5-minute walk to Orchard Boulevard MRT station.
The top gainer in the RCR in terms of gross profit was for unit transacted at The Anchorage in District 15, which fetched a gross profit of $2.7 million (annualised profit of 4.1%), based on caveats lodged. The 2,088-sq ft 15th floor unit was sold for $4.1 million, with a holding period of 26 years. The freehold project located in Alexandra was built in 1997 and situated within close proximity to commercial amenities such as Anchorpoint shopping mall, IKEA Alexandra, and Queensway Shopping Centre.
Over in the OCR, the top gainer in October was a 4th floor unit located in Parbury Hill Condominium in District 16. The 2,067-sq ft unit was sold for $3.35 million, achieving an estimated profit of nearly $1.85 million - which reflects an annualised profit of 2.7% over a holding period of nearly 30 years. The freehold project along Parsbury Avenue was built in 1997, and it is a stone throw away to the East Coast Park and walking distance to the upcoming Bedok South MRT station along the Thomson East Coast line (TEL).
Amid lowering interest rates and rising new launch prices, condo resellers may stand to benefit as some homebuyers may find themselves priced out of the new launch market and could consider options in the resale segment.